User manual
A short, practical guide: from installing the app to exporting your first analyzed result. Everything here works with the bundled sample datasets — no data of your own required to follow along.
Quick start
- Install. Run the Windows installer and launch the app. The R statistical engine ships inside the installer, so there is no separate setup. On first launch, accept the evaluation license agreement.
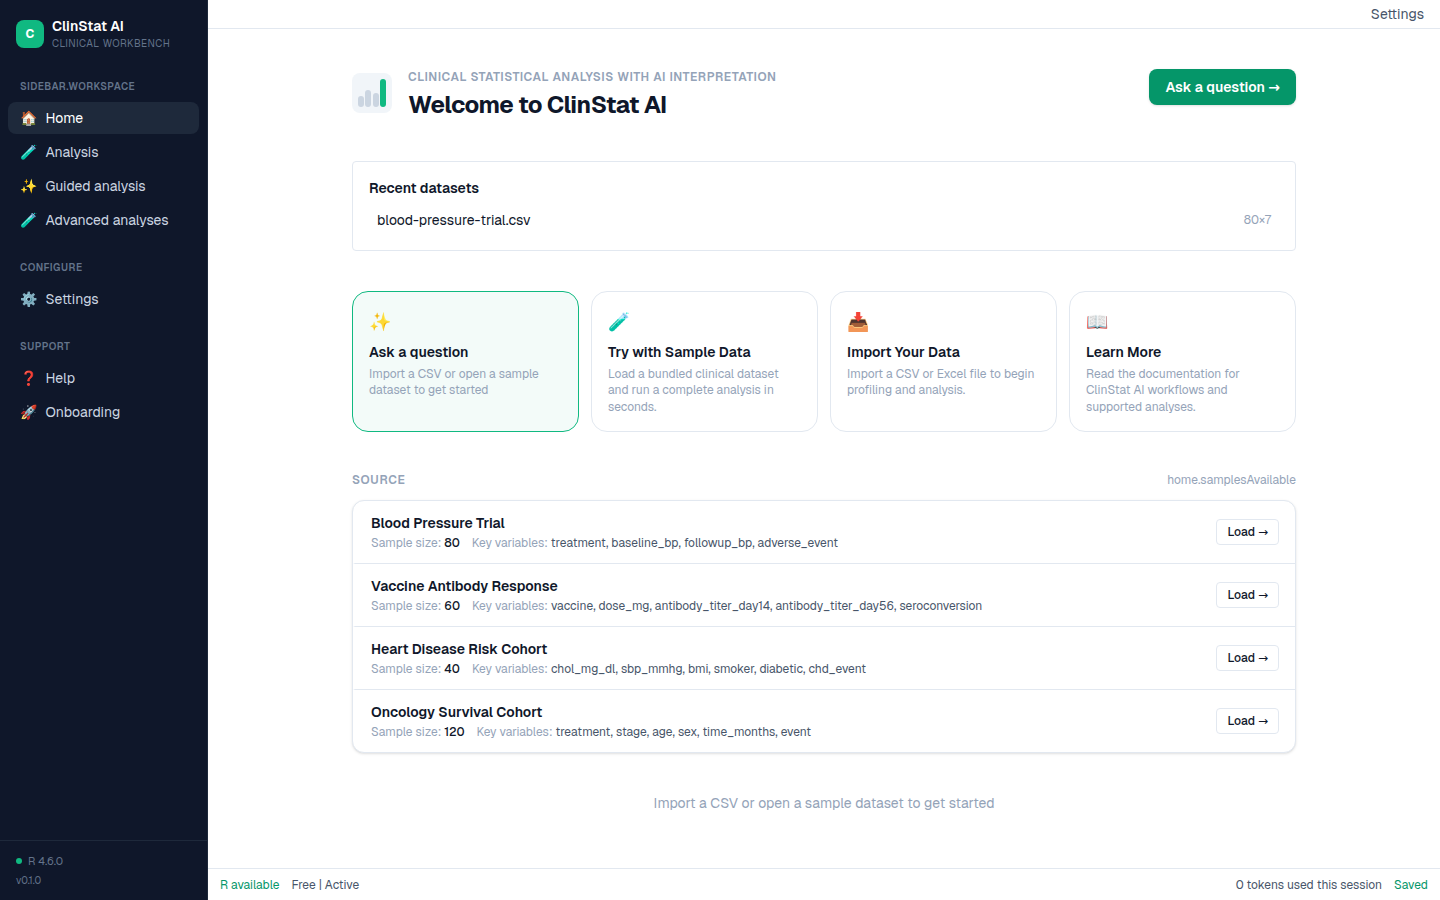
- Load a sample dataset. On the welcome screen, click one of the bundled clinical datasets — for example the Blood Pressure Trial (n = 80). It loads instantly, and the app profiles every variable automatically.
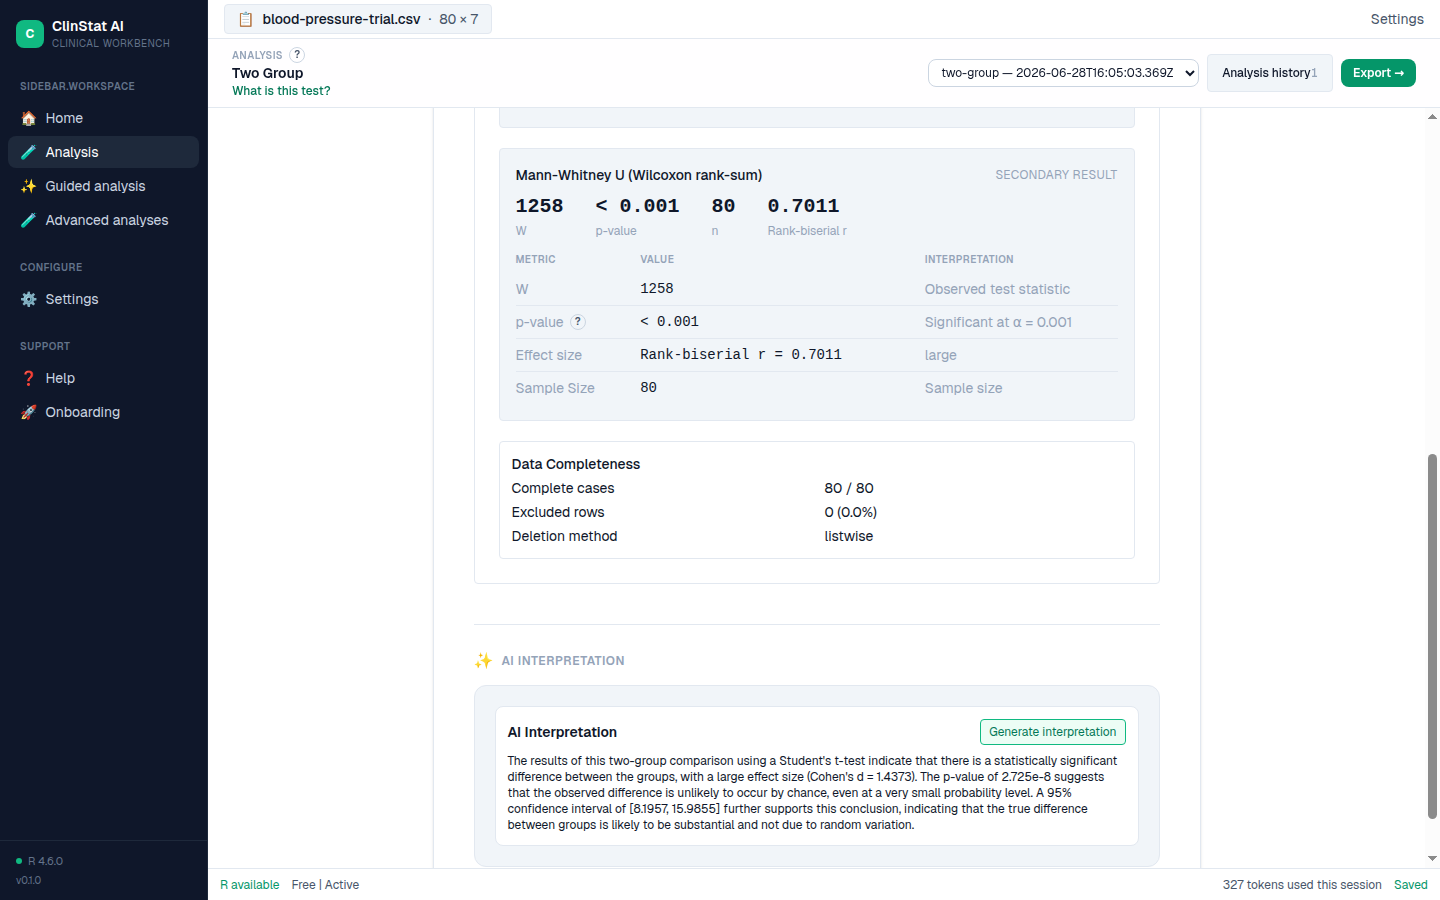
- Run your first analysis. Open the Analysis page, pick a test (say, a two-group t-test), assign the variables, and press Run. The statistics table, assumption checks, and figures appear in seconds.
If you want AI interpretation as well, configure a local language model during onboarding or later under Settings → AI provider — see AI interpretation. Skipping it is fine: every statistical feature works without an AI provider.
Importing data
Choose Import your data on the welcome screen, or File → Import. Pick a file, review the preview, and confirm.
| Format | Extensions | Notes |
|---|---|---|
| CSV | .csv | Most robust; UTF-8 assumed |
| Excel | .xlsx, .xls | First sheet imported by default |
| Stata | .dta | Labels preserved as factor levels |
| SPSS | .sav | Value and variable labels preserved |
| SAS | .sas7bdat | Labels preserved |
The preview grid shows the first rows, the detected column types, and any parsing warnings. You can rename columns, override a detected type (for example, treat a 0/1 coded column as a binary factor), or exclude columns from analysis before confirming.
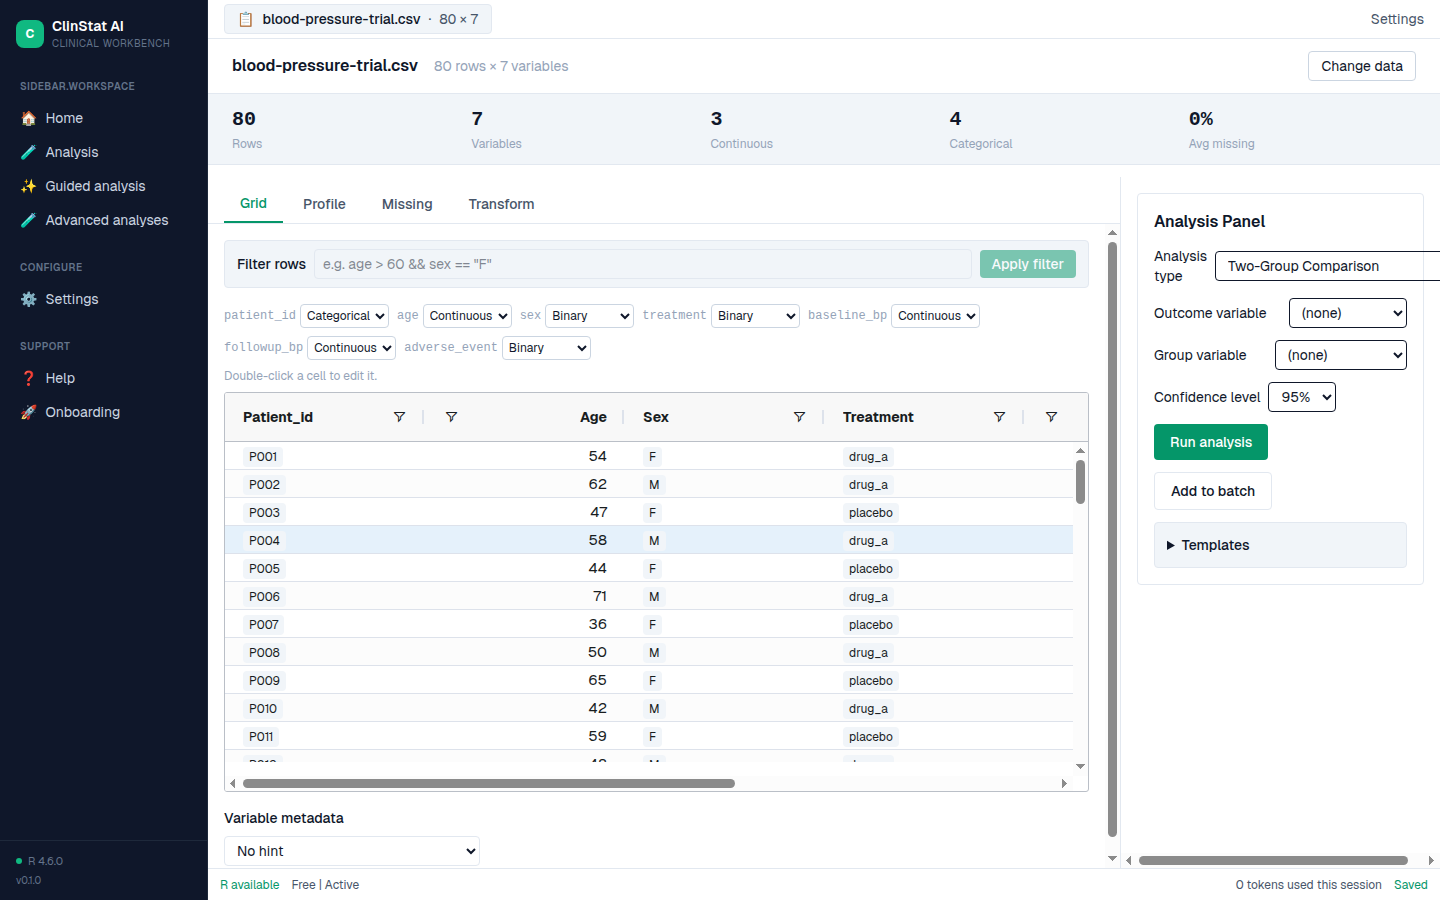
After import, the Data page shows the dataset in a fast grid and a one-card-per-variable profile: distribution, summary statistics, and missingness. Columns that look like patient identifiers are automatically excluded from analyses unless you explicitly select them.
Running analyses
The Analysis page is where every test runs. Select a test from the left panel, assign your variables in the main panel, and press Run. The app checks your choices — variable types, sample size — before the computation starts, and warns about common mistakes (such as a t-test on clearly non-normal data) before you run, not after.
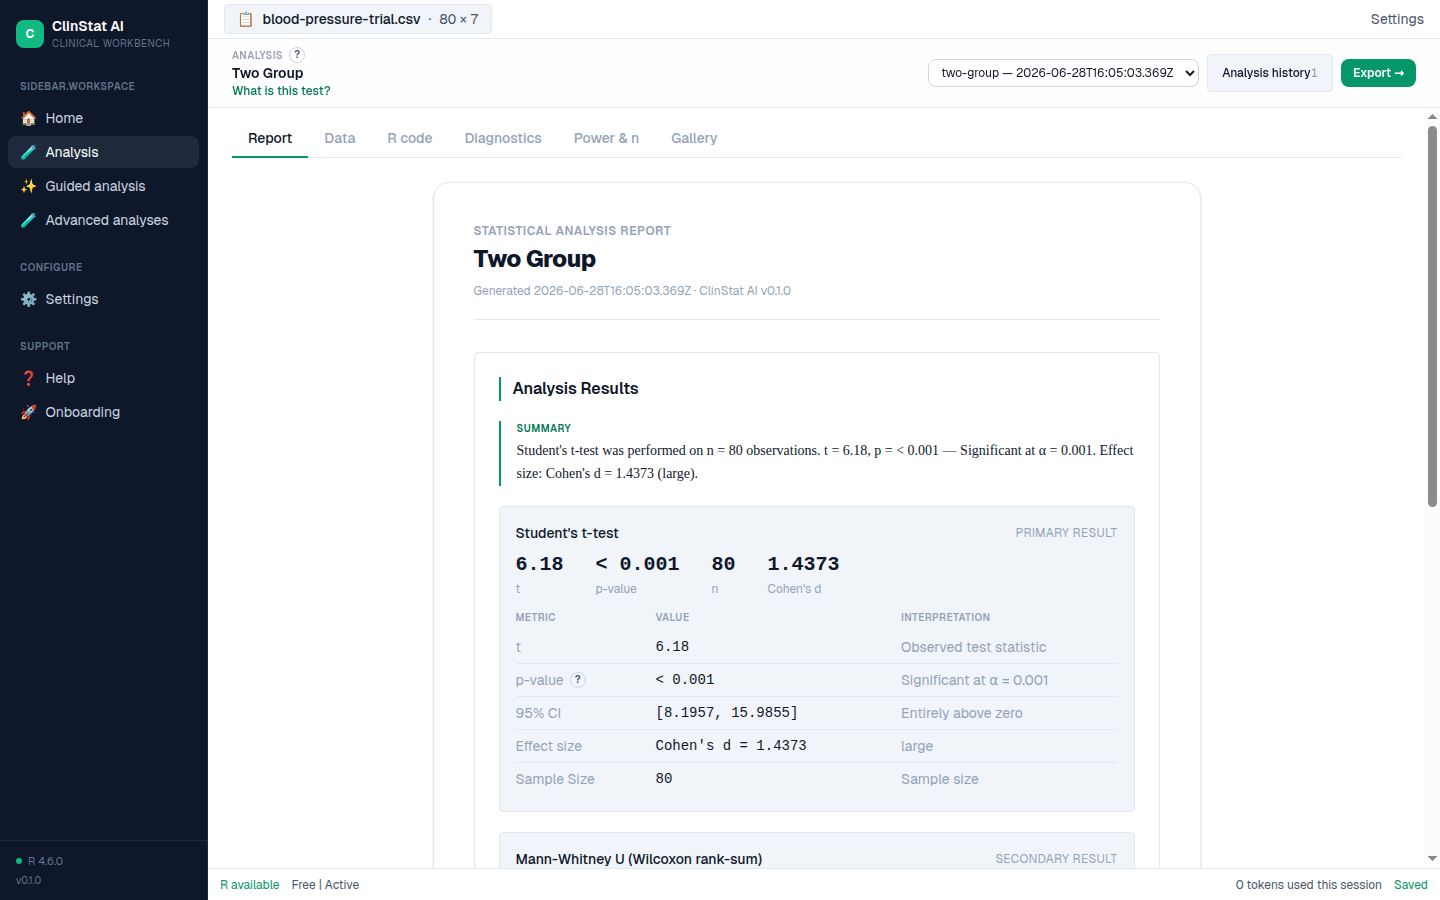
Results include the statistics table with effect sizes, an assumption-check summary, and publication-ready figures. The repertoire covers the common clinical tests (t-tests, ANOVA, chi-square, correlation, linear and logistic regression), survival analysis (Kaplan–Meier, Cox), longitudinal methods, causal-inference adjustments, diagnostic metrics (ROC), and Bayesian regression.
Guided flow
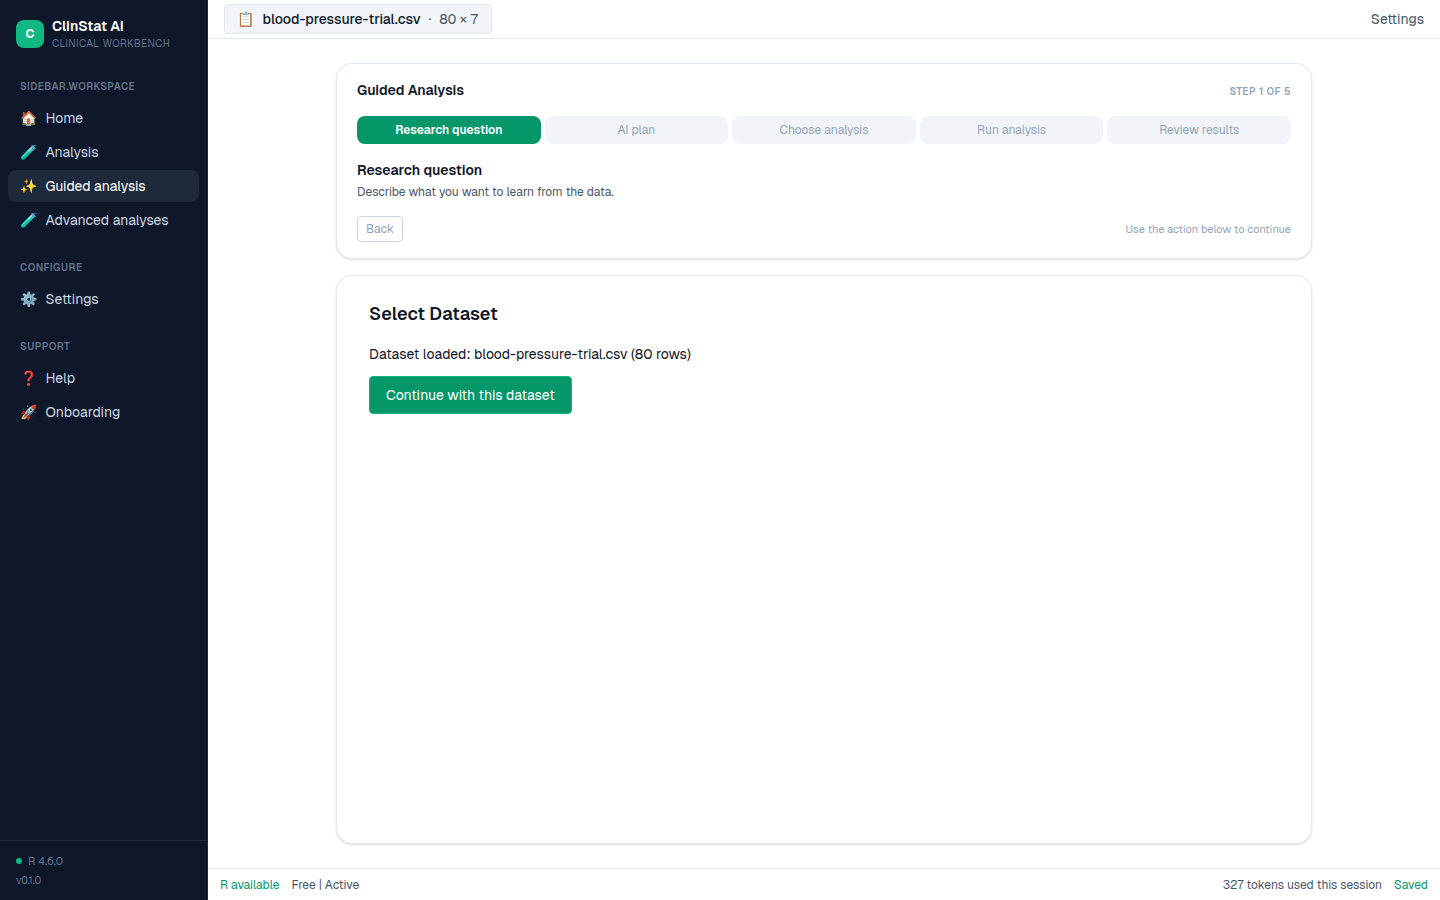
Prefer not to pick tests from a menu? The Guided wizard walks a structured path:
- Pick the dataset.
- Type your research question in plain language — for example, “Does the treatment reduce blood pressure compared to placebo?”
- Review the proposed analysis plan: test, variables, and why. Accept it, modify it, or rephrase the question.
- The wizard runs the analysis and shows the standard results view, with AI interpretation and export options at the end.
The AI can also propose a sequence of several analyses with justifications — useful when you have a vague direction and want a defensible methods plan laid out.
Exporting results
From the export dialog you can produce:
- Word — a manuscript-ready document with a title page, a methods paragraph generated from the analysis provenance, results tables, figures, and the AI narrative if you ran it.
- Excel — a multi-sheet workbook: data, summary statistics, one row per analysis run, embedded figures, and a provenance sheet.
- Figures — PNG at 300 DPI or vector SVG.
- R code — a standalone, runnable
.Rfile for every analysis (see below).
Reproducibility, built in Every exported R file contains a pure analysis function plus a wrapper that reproduces the exact run you made — with the R version, package versions, random seed, and a dataset hash in the appendix. Paste it into a supplement and your methods section is done.
For trials and observational studies, CONSORT and STROBE reporting checklists can be exported pre-filled and cross-linked to the parts of your project that satisfy each item.
AI interpretation
The AI layer drafts a plain-language summary of each result, a methods-section paragraph you can paste into a manuscript, and cautions — violated assumptions, small samples, effects that are statistically significant but clinically trivial.
The privacy contract The AI model you configure receives only aggregated summaries — test statistics, group means, effect sizes, variable metadata. It never receives row-level data or patient identifiers, and identifier-like columns are excluded automatically.
Setting it up
ClinStat AI talks to any OpenAI-compatible endpoint, which in practice means a local model server you run yourself — LM Studio (default port 1234) and Ollama (default port 11434) are the common choices. In Settings → AI provider, enter the base URL, pick a model with Discover models, and press Test connection. An API key is optional for local servers; if you use one, it is stored in your operating system's keychain, never in a plain file.
A smaller, fast model is the sweet spot for interactive use — it keeps interpretation quick. Very large or “reasoning” models can exceed the request timeout; use those only for occasional, publication-grade passes. And if you skip setup entirely, the app runs in standalone mode: every statistical feature works, only the narrative panel is disabled.
Troubleshooting
The app seems to start, but no window appears
A saved window position is probably off-screen — this can happen after changing monitors. Delete the window-state file in the app's data folder and relaunch; the window reappears at its default position.
The footer says “R not found”
Open Settings → R and press Re-detect. If you maintain your own R installation, make sure it is a recent R 4.x and installed in a standard location; the bundled engine covers most setups out of the box.
AI interpretation fails or times out
Check that your model server is actually running, that the base URL in Settings → AI provider is right, and use Test connection. Timeouts usually mean the model is too large or a slow “reasoning” model — switch to a smaller, faster one. Everything except the narrative works while you sort it out.
License note
ClinStat AI is currently released under an evaluation license, accepted on first launch. In brief: the software is provided for evaluation use; commercial use, clinical decision-making, and redistribution are not permitted.
ClinStat AI is a statistical analysis tool. It is HIPAA-aware but not HIPAA-certified, it is not a substitute for medical judgement, IRB approval, or applicable data-protection controls, and its output must not be used for patient care.
Questions or feedback: hello@clinstat.ai.